Evaluation of our communications activity is crucial in demonstrating the effectiveness of our work. But what does good really look like?
Find out how we went beyond vanity metrics and developed a deep dive evaluation approach to gain meaningful insights for BEIS’s videos and creative content.
A world of data
Digital has so much data. In BEIS, the way we make sense of the data has been focussed on impressions and engagement rate which many teams use to measure the effectiveness of their messaging. But we wanted to go further than that by finding a way to measure the success of our videos and creative content so we could learn what worked well and apply findings to future content.
Where do you start?
A consistent approach is vital. I pulled data from Twitter analytics every Wednesday to cover the previous week’s activity before (Monday to Sunday). I then measured success against the call to action for each piece of content, focusing on:
- impressions
- engagement rate
- video views
- click through rate
- retention rate (at 25% and 100% of the video)
It is also important to analyse the variables in our content so that recommendations can be formed for certain types of content and call to actions. These cover:
- date
- time of day
- number of words used
- content
- policy area
- length in seconds
I then combined both these types of evaluation to produce my findings each month which helped me develop my recommendations.
Findings
Evaluating our creative content using the parameters set over a period of time showed some conclusive and consistent trends.
Top performing videos
Our top performing videos were:
- 30 seconds or under in length
- those with short summarised text
- animations, outperforming filmed content
- ones posted during commuting times
Worst performing videos
Our worst performing videos were:
- more than 50 seconds long
- had more than 40 words in the video
- featured ministers talking directly to camera
- posted at the weekend
Using evaluation to change our work
The deep dive evaluation gave us content-specific data to feed into communications planning such as drafting OASIS plans, providing communications advice to ministers and completing campaign reports.
We are able to challenge colleagues on providing long scripts for content because we have data that shows the shorter the script and the shorter the video, the more engaging it is.
We have started re-posting weekend video content during the week and have seen an increase in overall success rate of content posted at weekends.
After seeing how well animations are received, we are animating text and photography as well as graphics.
Green jobs aren't what you think. Could there be one out there for you? https://t.co/rDR7k4Y3Ct #GreenGB #IndustrialStrategy pic.twitter.com/9weipW0gjc
— Department for Science, Innovation and Technology (@SciTechgovuk) October 12, 2018
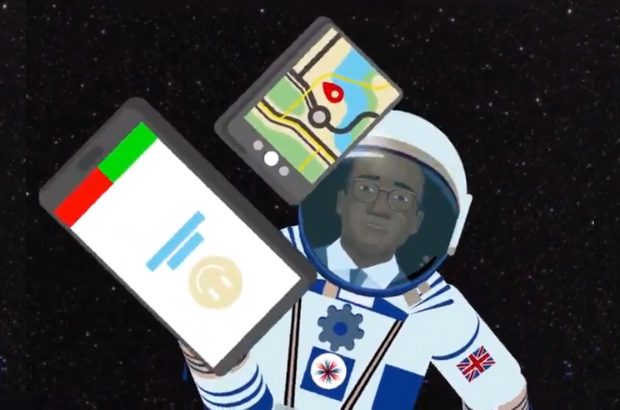
We have also looked at innovative ways to give ministers a digital presence on our channels. As a government first, we have used an avatar of our Science Minister, Sam Gyimah, to explain what the department is doing in the areas of research and innovation. Watch the videos in the Science Spotlight series.
Most importantly, we can now base creative ideas on learnings not assumptions, constantly improving our content and reacting to our audience.
Stay up-to-date by signing up for email alerts from this blog.